KPIs and profit
The KPIs tab shows your key business numbers for any period you pick: revenue, money collected, outstanding balances, profit, labor, average ticket and lead conversion. Every number opens the records behind it.
Open Dashboard in the sidebar, then select the KPIs tab. You need an admin login. The numbers come from your invoices, payments, jobs, recurring series, expenses and leads, plus your employees' time clock entries and hourly rates.
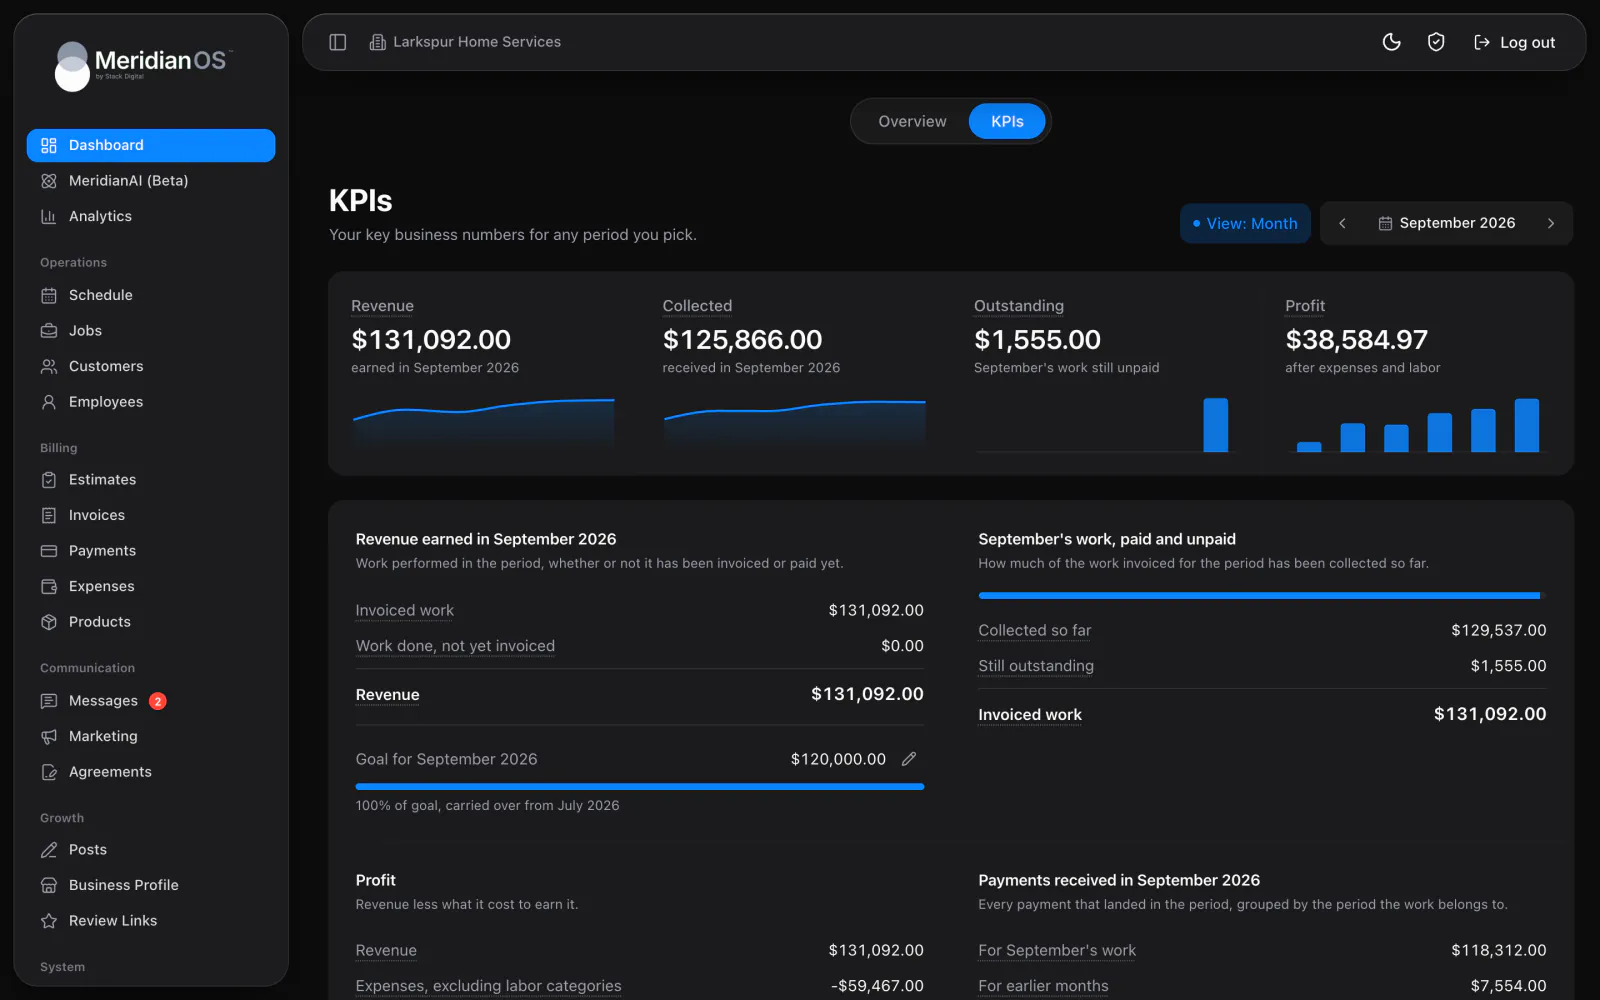
Pick a period
- Under View, choose Day, Week, Month or Year.
- Use the previous and next arrows to move one period at a time.
- To jump further, open the pop-up picker. Day and Week show a calendar. Month shows a month grid with This month. Year shows a year grid with This year.
- Weeks run Monday to Sunday.
- Future periods are disabled.
- The page refreshes itself every 5 seconds while the tab is visible.
The four headline numbers
The top row shows four numbers for the period. Each has a mini chart of the last six periods.
| Number | Mini chart |
|---|---|
| Revenue | Area chart. |
| Collected | Area chart. |
| Outstanding | Bar chart. |
| Profit | Bar chart. Negative bars are red. |
The four ledgers
Below the top row, four ledgers show how the numbers add up. Some ledger titles include the period or month you picked.
| Ledger | How it adds up |
|---|---|
| Revenue earned, followed by the period | Invoiced work plus Work done, not yet invoiced equals Revenue. A hint shows the amount still scheduled, which is not counted yet. |
| The month's work, for example November's work, paid and unpaid | A progress bar with Collected so far, Still outstanding and Paid over the invoice amount. The total is Invoiced work. |
| Profit | Revenue less Expenses equals Profit. Labor is also subtracted when Count labor in profit is on. |
| Payments received, followed by the period | Payments for the month's work (for example For November's work), For earlier months and Paid ahead for later months add up to Collected. |
Labor, average ticket and lead conversion
A second row shows three more numbers for the period.
| Number | What it shows |
|---|---|
| Labor | The hours clocked and their cost across your employees. Cost is clocked hours times each employee's hourly rate. Open shifts count up to now. Voided entries are ignored. |
| Average ticket | Your average ticket for the period. Select it to see how it is worked out. |
| Lead conversion | How many leads became jobs, written as X of Y leads became jobs. A lead counts as converted once its customer has a job created after the lead arrived. |
How the numbers are counted
- Revenue counts in the period the work was done. Collected counts payments in the period they were received.
- Work that is done but not yet invoiced is shown on its own line. One-off jobs in it are flagged needs an invoice.
- Recurring visits billed on one roll-up invoice each carry their share of what has been paid on it.
- For a recurring series, Count revenue in sets whether revenue counts in the month the work was done or the month it is billed. See Billing a recurring series.
- Payments are split into this period's work, earlier work and paid ahead. Overpayments get their own line, so the ledger still adds up.
- In Day and Week views, monthly expenses are spread evenly by day, so a short period still carries its share of expenses.
- Expenses are the ones you log. The page has a Log expenses link for adding them. See Expenses and products.
Count labor in profit
The Profit ledger has a switch, Count labor in profit. Turn it on to subtract clocked labor from revenue along with your expenses. For how hours are clocked, see Time clock and payroll.
With the switch on, expense categories named labor, payroll or wages are left out of profit, so labor is not counted twice. The page says so on screen.
See the records behind a number
- Select any label on the page, or any cell in the last six table.
- Read the plain-language explanation of how the number is calculated.
- Go through the line-by-line records behind it. Each one links to its invoice, job, customer, employee or expense.
The last six periods
A table titled Last six days, weeks, months or years, matching your View, lines up the last six periods side by side. It covers Revenue, Collected, Outstanding, Profit, Labor, Average ticket and Lead conversion. Select any cell to see the records behind it.
Monthly revenue goal
In Month view, the page shows a revenue goal for the month (for example Goal for November), a progress bar and the percent reached, such as 80% of goal. Set or change the goal there.
A goal applies to its month and carries forward to future months until you set a new goal. The page says which month the goal came from.
Related
- DashboardWhat the Overview tab shows: money collected, jobs, estimates, unpaid invoices, the day's schedule, a map and recent activity.
- Expenses, products and servicesEnter monthly expenses by category for your profit numbers, and keep a catalog of products and services for line items.
- Time clock and payrollHow employees clock in and out, how you correct and approve hours, and how to set overtime, pay periods and the payroll export.
- InvoicesCreate and send invoices, set terms, record payments, and see what reminders and recurring billing do on their own.
- KPIs and profit overviewRevenue, collected, outstanding, and profit for any period, each one click from the records behind it.
Updated November 10, 2026.