Website analytics and Google Ads
The Analytics page shows who visits your website and how they find it. A second tab reports the results of your Google Ads, from impressions and clicks to cost and conversions.
Open Analytics in the sidebar. You need an admin login. The page has two tabs, Website and Google Ads. For revenue, profit and money collected, see KPIs and profit.
Choose a date range
Both tabs use the same date range picker. Choose 7 days, 14 days, 30 days or 90 days, or set a custom start date and end date.
Website tab: visitors
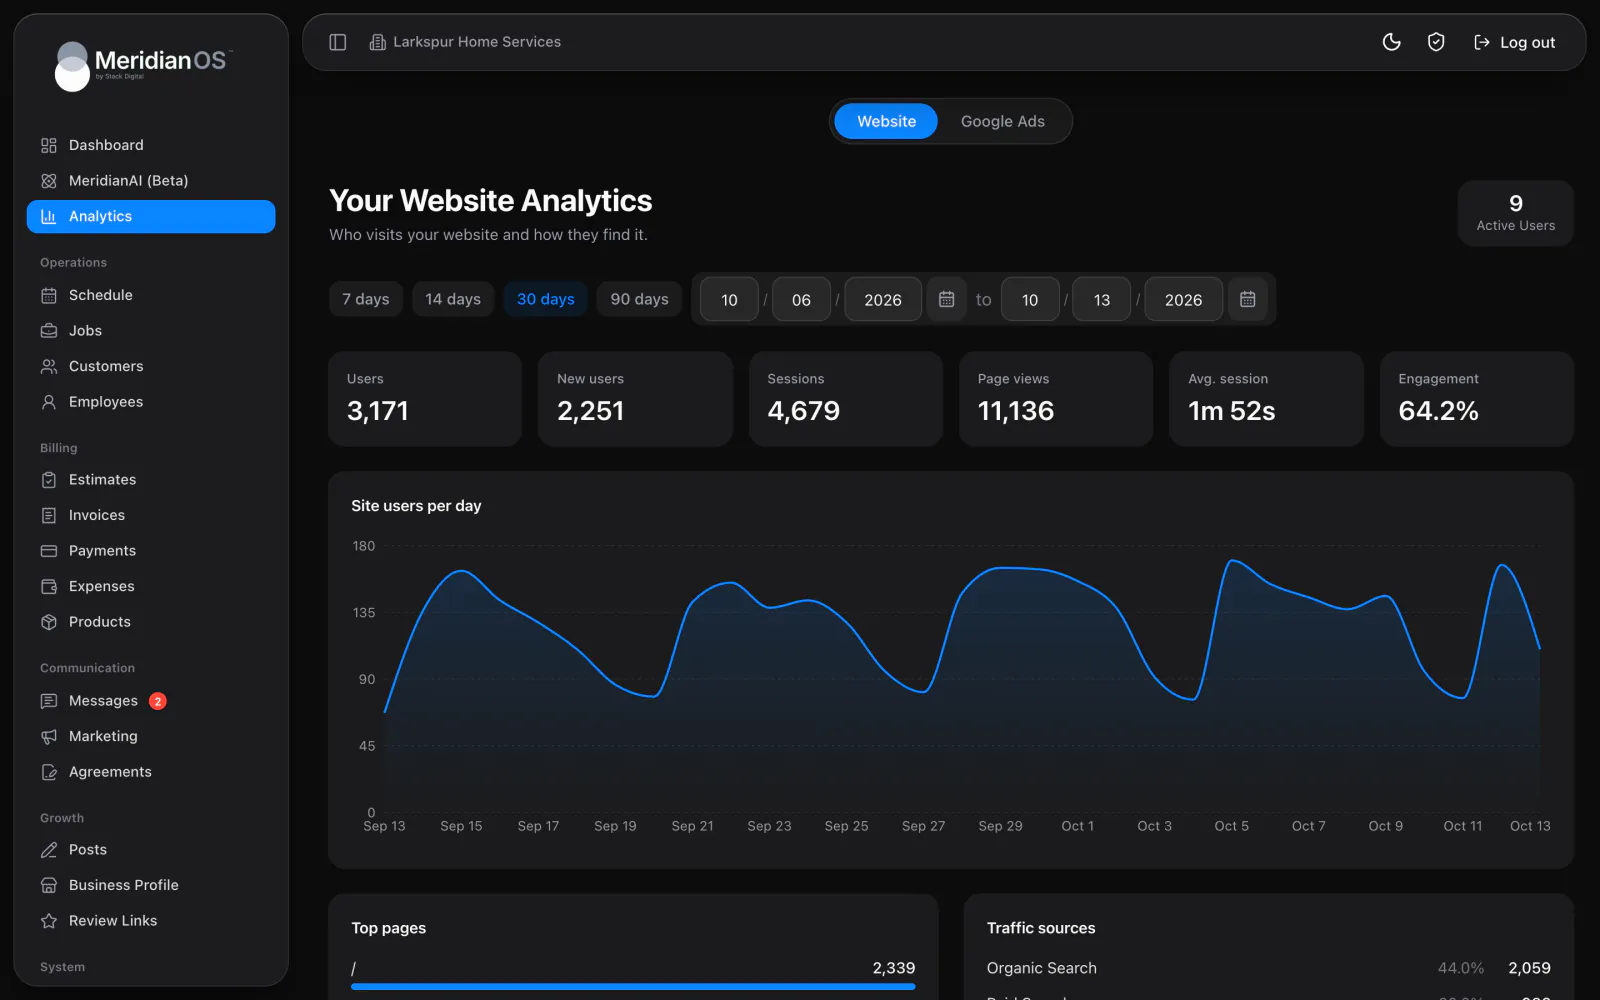
The Website tab is headed Your Website Analytics, with the line Who visits your website and how they find it. A live Active Users counter shows how many people are on your website right now. It refreshes every 15 seconds.
Six stat cards cover the date range you picked: Users, New users, Sessions, Page views, Avg. session and Engagement. The Site users per day area chart plots your users for each day in the range.
Website tab: pages, sources, locations and devices
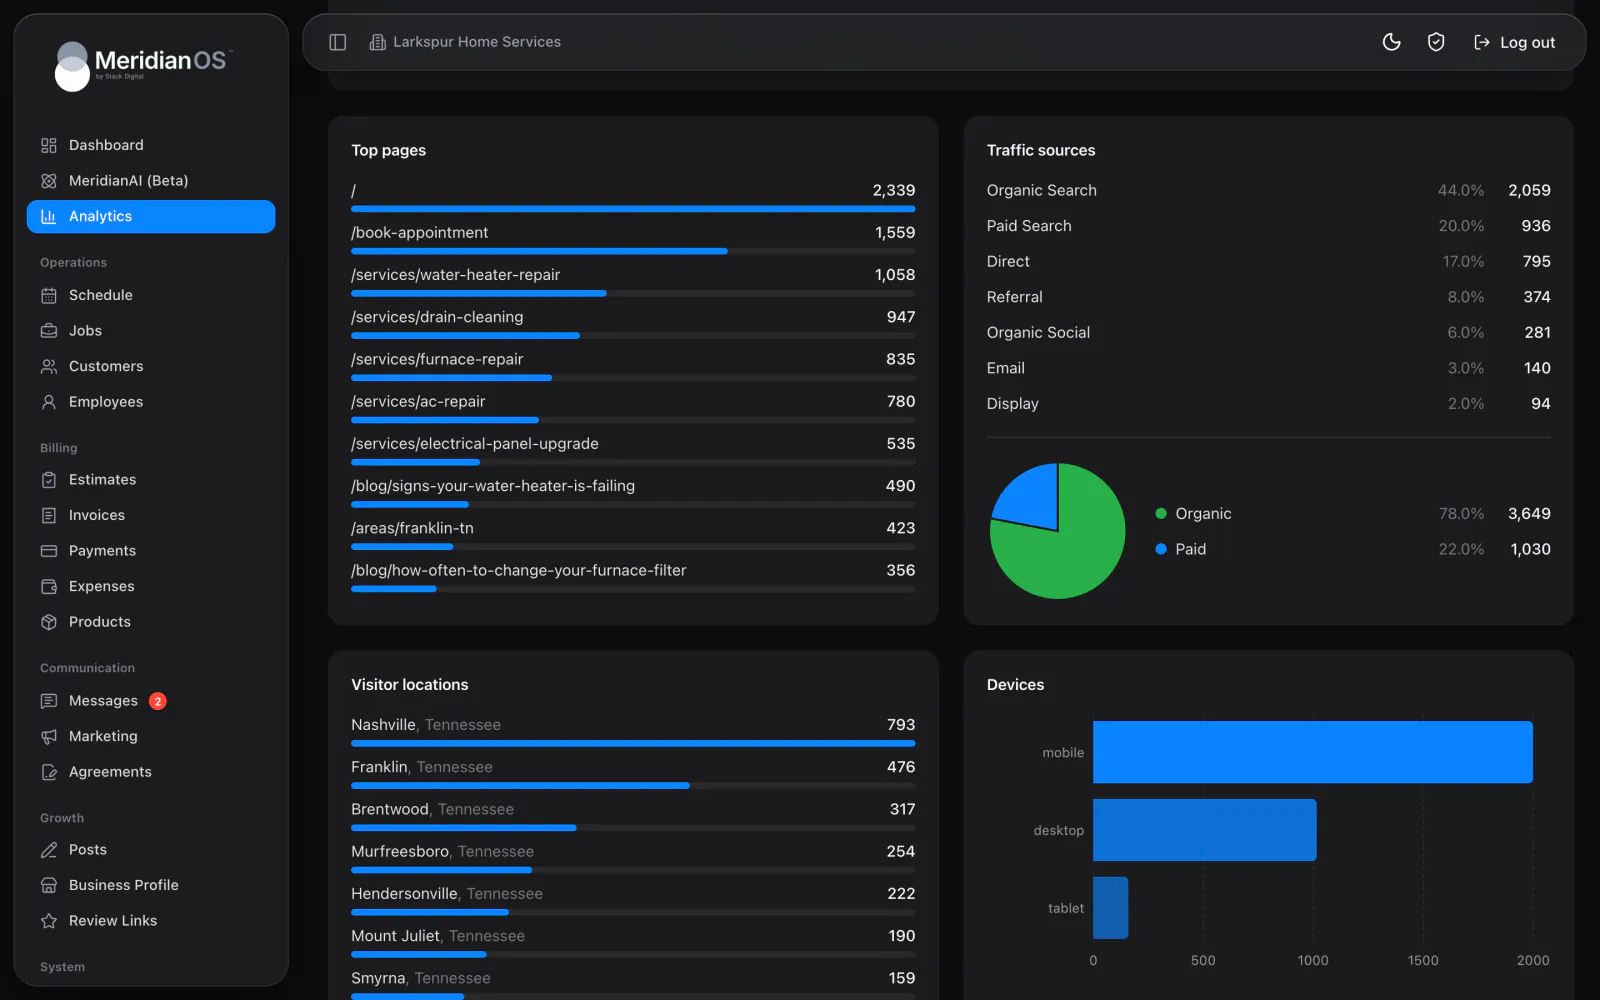
Four more cards on the Website tab break your visits down.
| Card | What it shows |
|---|---|
| Top pages | Your top 10 pages, with bars. Admin, employee, payment and estimate pages are filtered out, so only public pages are ranked. |
| Traffic sources | A list of channels with each one's share and sessions, plus a pie chart of Organic against Paid. |
| Visitor locations | Your top 12 locations by city and state. |
| Devices | A horizontal bar chart of the devices your visitors use. |
Where the website numbers come from
The Website tab reads your site's Google Analytics property. There is no connect screen for it in your admin. Stack Digital turns this on for your site.
If the tab shows a message that begins Could not load analytics data, text or email Stack Digital at support@stackdigital.com.
Connect your Google Ads account
You connect your own Google Ads account on the Google Ads tab. The tab reports on that account for the date range you pick.
- Open Analytics, then the Google Ads tab.
- Under Connect your Google Ads account, sign in with Google.
- Under Choose your Google Ads account, pick the account to report on. This works when your Google login manages several accounts.
- Change account switches the report to a different Google Ads account.
- Disconnect removes the connection.
The connection is read-only. The tab states: The dashboard only reads reporting data and never changes your campaigns. You keep managing your ads in your Google Ads account.
The tab needs Google sign-in set up for your site. Stack Digital turns this on for your site. Until then it shows Google Ads reporting is not available on your website yet. To have it set up, text or email Stack Digital at support@stackdigital.com.
Google Ads tab: stat cards
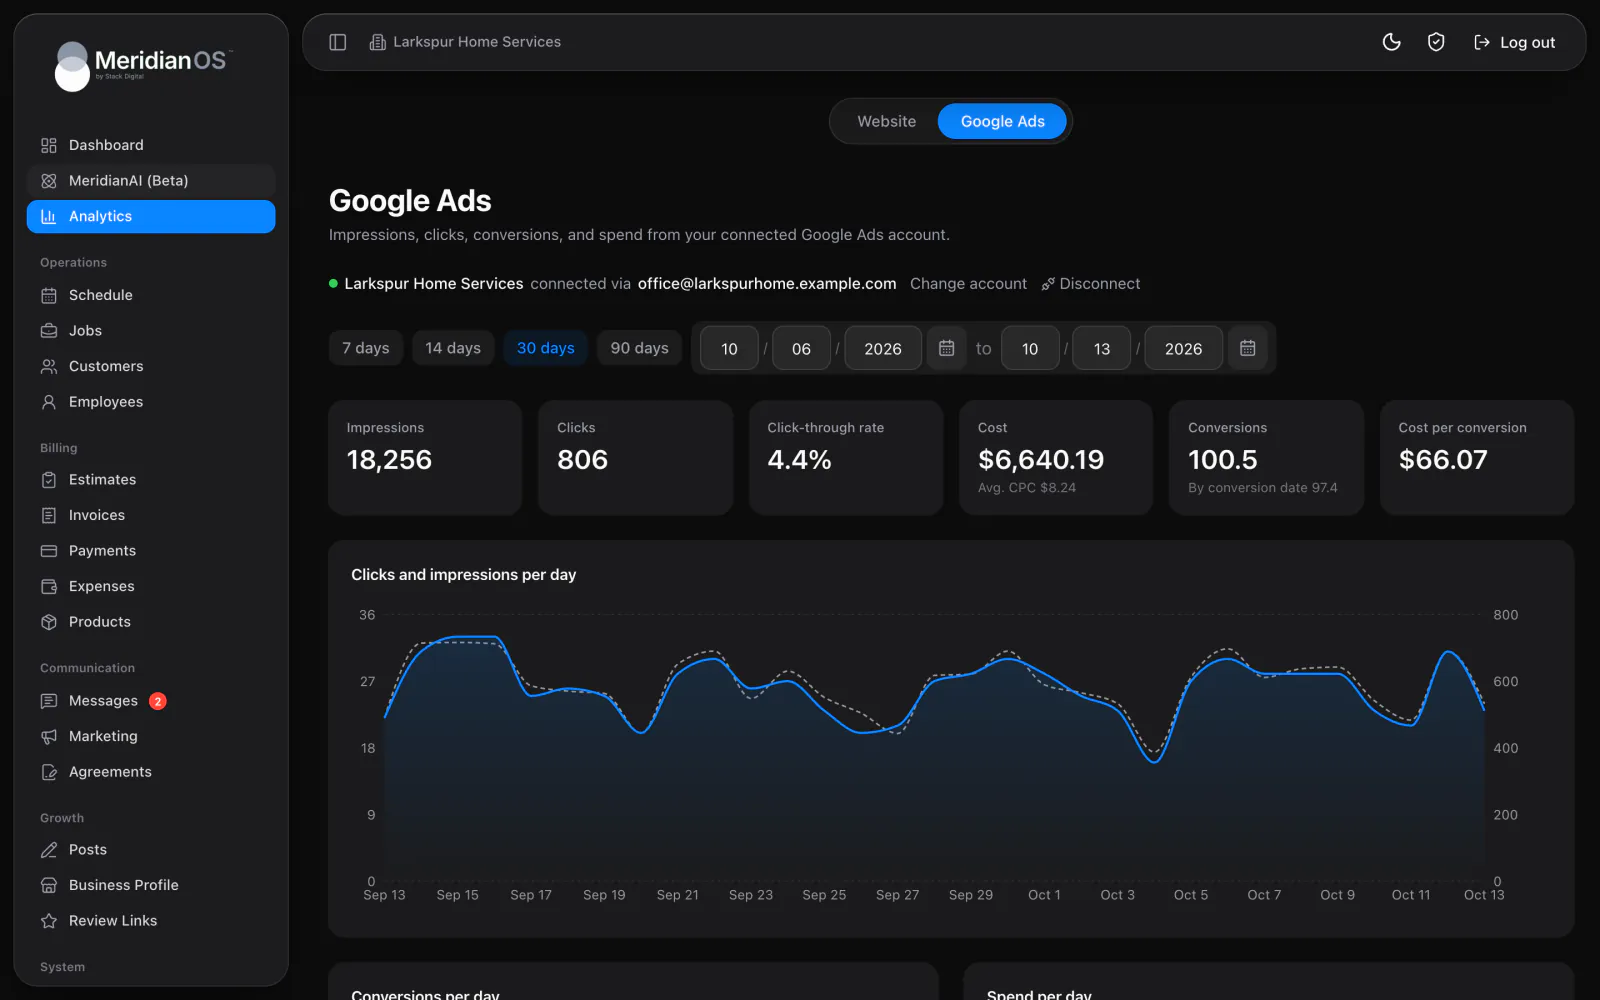
Six stat cards cover the date range you picked: Impressions, Clicks, Click-through rate, Cost, Conversions and Cost per conversion.
- The Cost card also shows Avg. CPC.
- The Conversions card is marked By conversion date.
- Amounts use your Google Ads account's own currency.
Google Ads tab: charts
Three charts plot the date range day by day.
| Chart | What it shows |
|---|---|
| Clicks and impressions per day | A two-axis chart with a line and an area. |
| Conversions per day | Bars comparing By click date with By conversion date. |
| Spend per day | Bars for each day's spend. |
Google Ads tab: campaigns
The Campaigns table has one row per campaign, with these columns: Campaign, Status (Active or Paused), Impressions, Clicks, CTR, Cost, Conversions and Cost / conv.
- The table shows up to 100 campaigns, ordered by spend.
- Removed campaigns and campaigns with no activity are hidden.
Related
- DashboardWhat the Overview tab shows: money collected, jobs, estimates, unpaid invoices, the day's schedule, a map and recent activity.
- KPIs and profitHow to read revenue, collected, outstanding, profit, labor and lead conversion for any period, and how each number is counted.
- Blog and automatic postsWrite and publish blog posts on your website, draft them with MeridianAI, and schedule automatic posts.
- Website analytics and Google Ads overviewWho visits your site and how they found it, next to what your ads returned.
Updated November 10, 2026.